
Marketing Reports
In this Article
In this article, you will learn how to generate reports about marketing follow-ups, and referrals from doctors, companies, employees and patients.
- 1
-
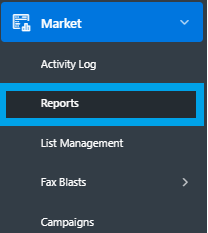
Follow-Up Marketing Reports
The primary follow-up report generates a view of all upcoming marketing efforts and what follow up actions are needed.
- Red Box
- You may change the number of weeks in advance that you want to view the follow-ups
- Blue Box
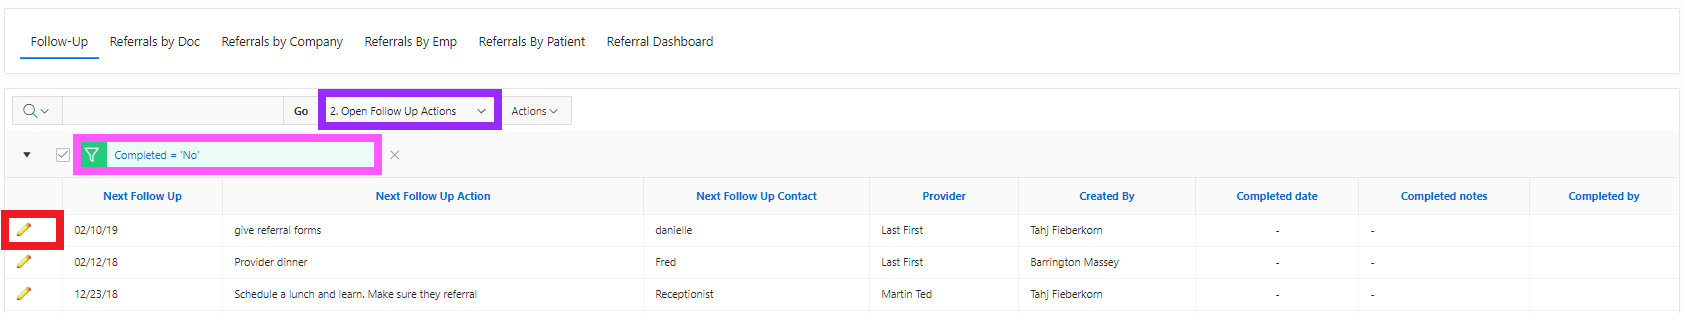
- You may edit an existing follow up by clicking on the edit pencil.
- Dark Purple Box
- Choose what follow-up report you wish to view.

To change the weeks of the follow up, click on the Next Follow Up is in the next 2 weeks filter box.
 Next, customize how you need the report to pull information. Click Apply once finished.

The Open Follow-Up Actions (purple box) report generates a view of all existing follow-ups that have not been completed. This will always default to a filter of Completed = 'No' (pink box).
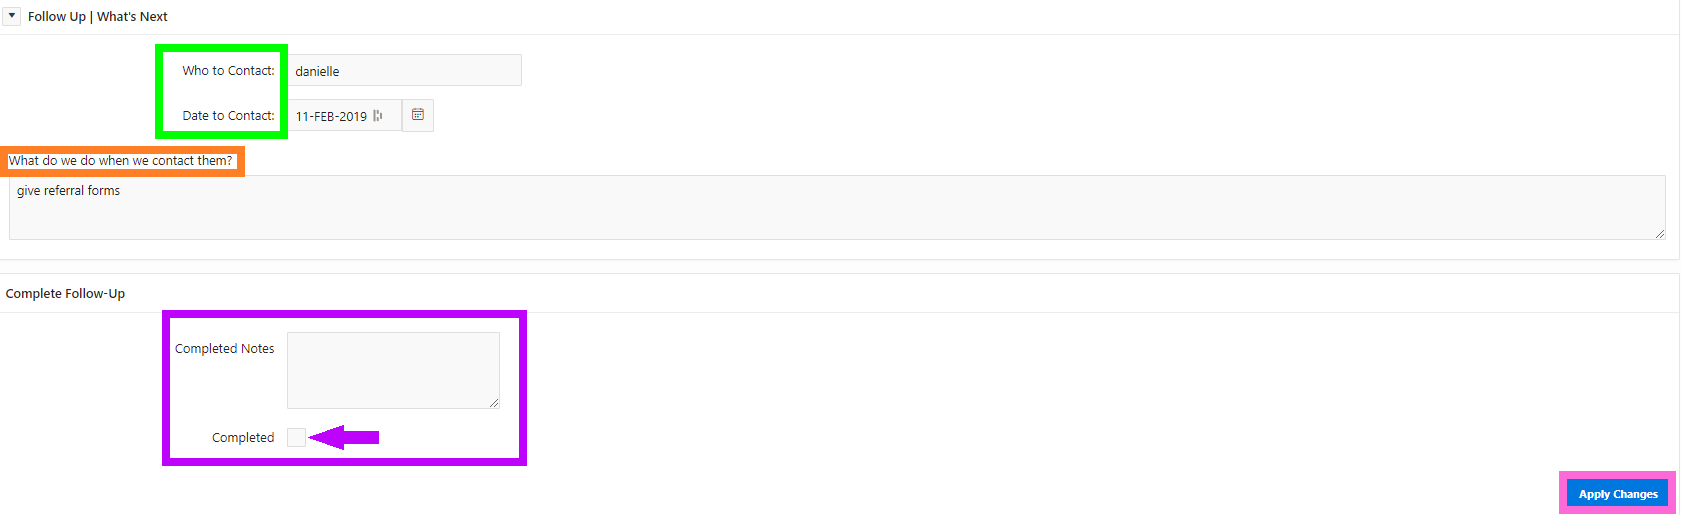
To mark as completed or edit the follow-up click the edit pencil (red box).
- Green Box
- Add your contact and date of contact
- Orange Box
- Add your action notes
- Purple Box
- Input your completed notes and click the completed box
- Pink box
- Apply changes
- 2
-
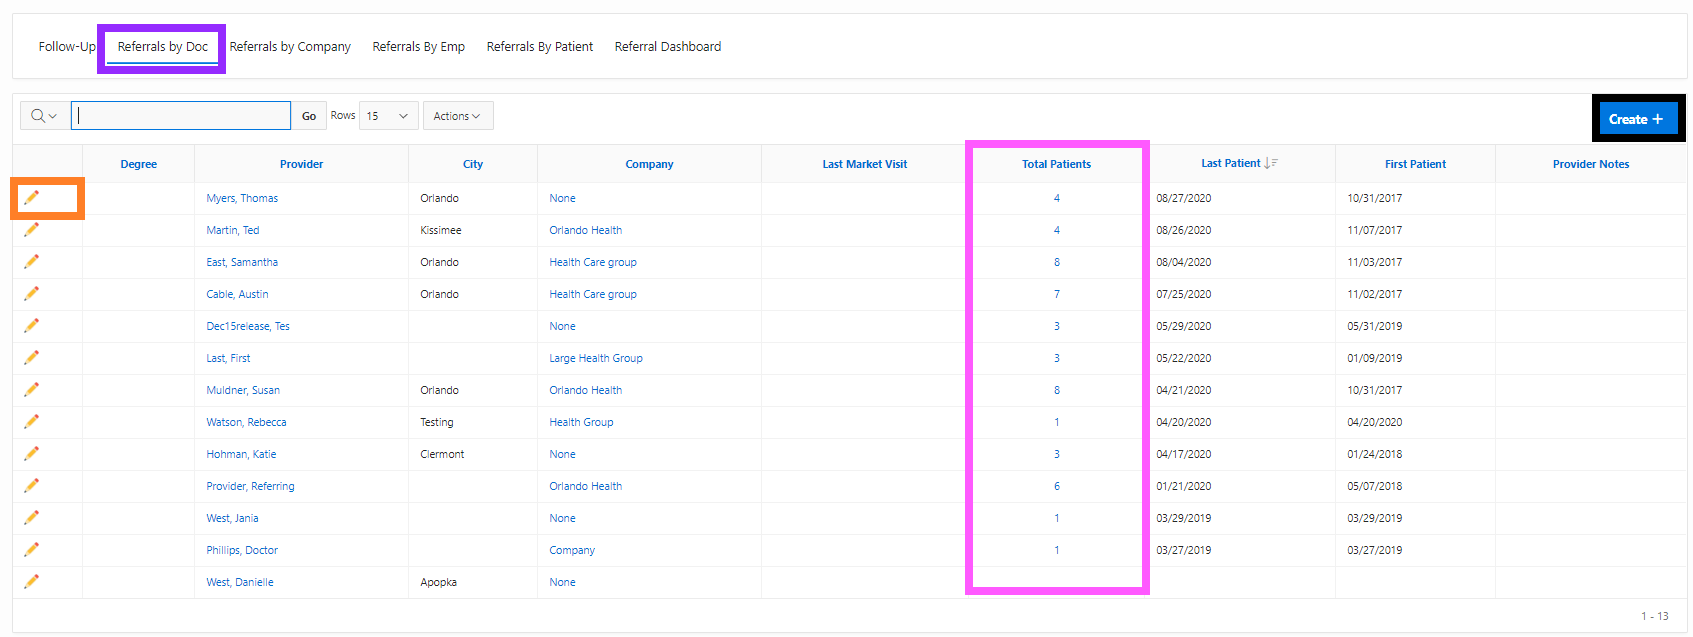
Referrals by Doc
This report generates the number of referrals by doctors and the first/last patient visit date. This will also show the number of patients that a doctor referred to you.
- Black Box
- To add a new referring doctor, click Create
- Orange Box
- To edit and/or update information on a current referring doctor, click on the pencil.
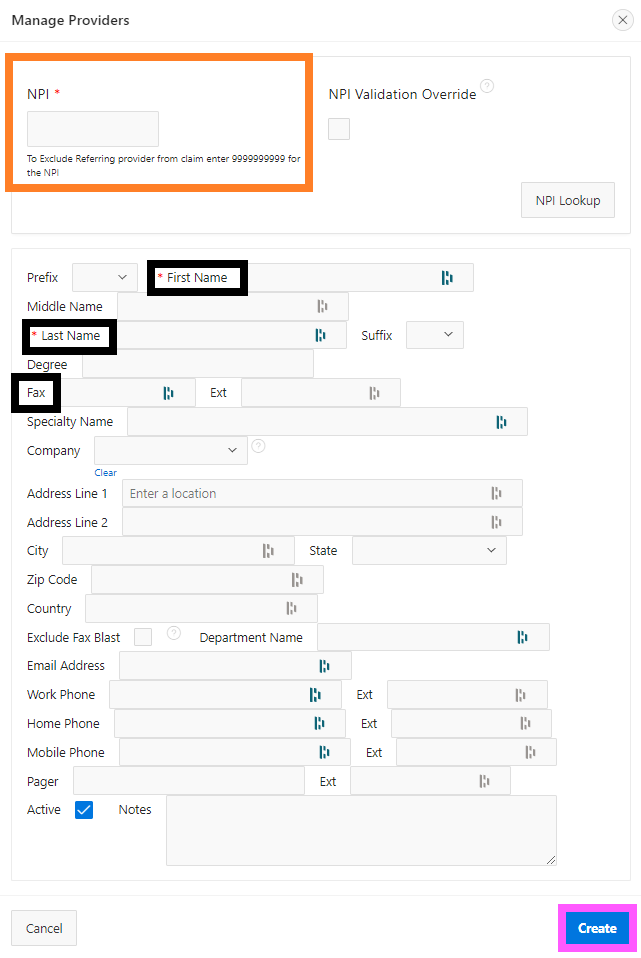
When entering a new referring provider make sure:
- You enter their NPI
- First Name
- Last Name
- Fax number
- Click Create once you are finished
- 3
-
Referrals by Company
This report generates the total number of referrals from the companies in your system as well as the first and last patient they referred.
- Blue Box
- To edit a current company, click on the name of the company that you wish to edit
- Orange Box
- To add a new company, click on Create
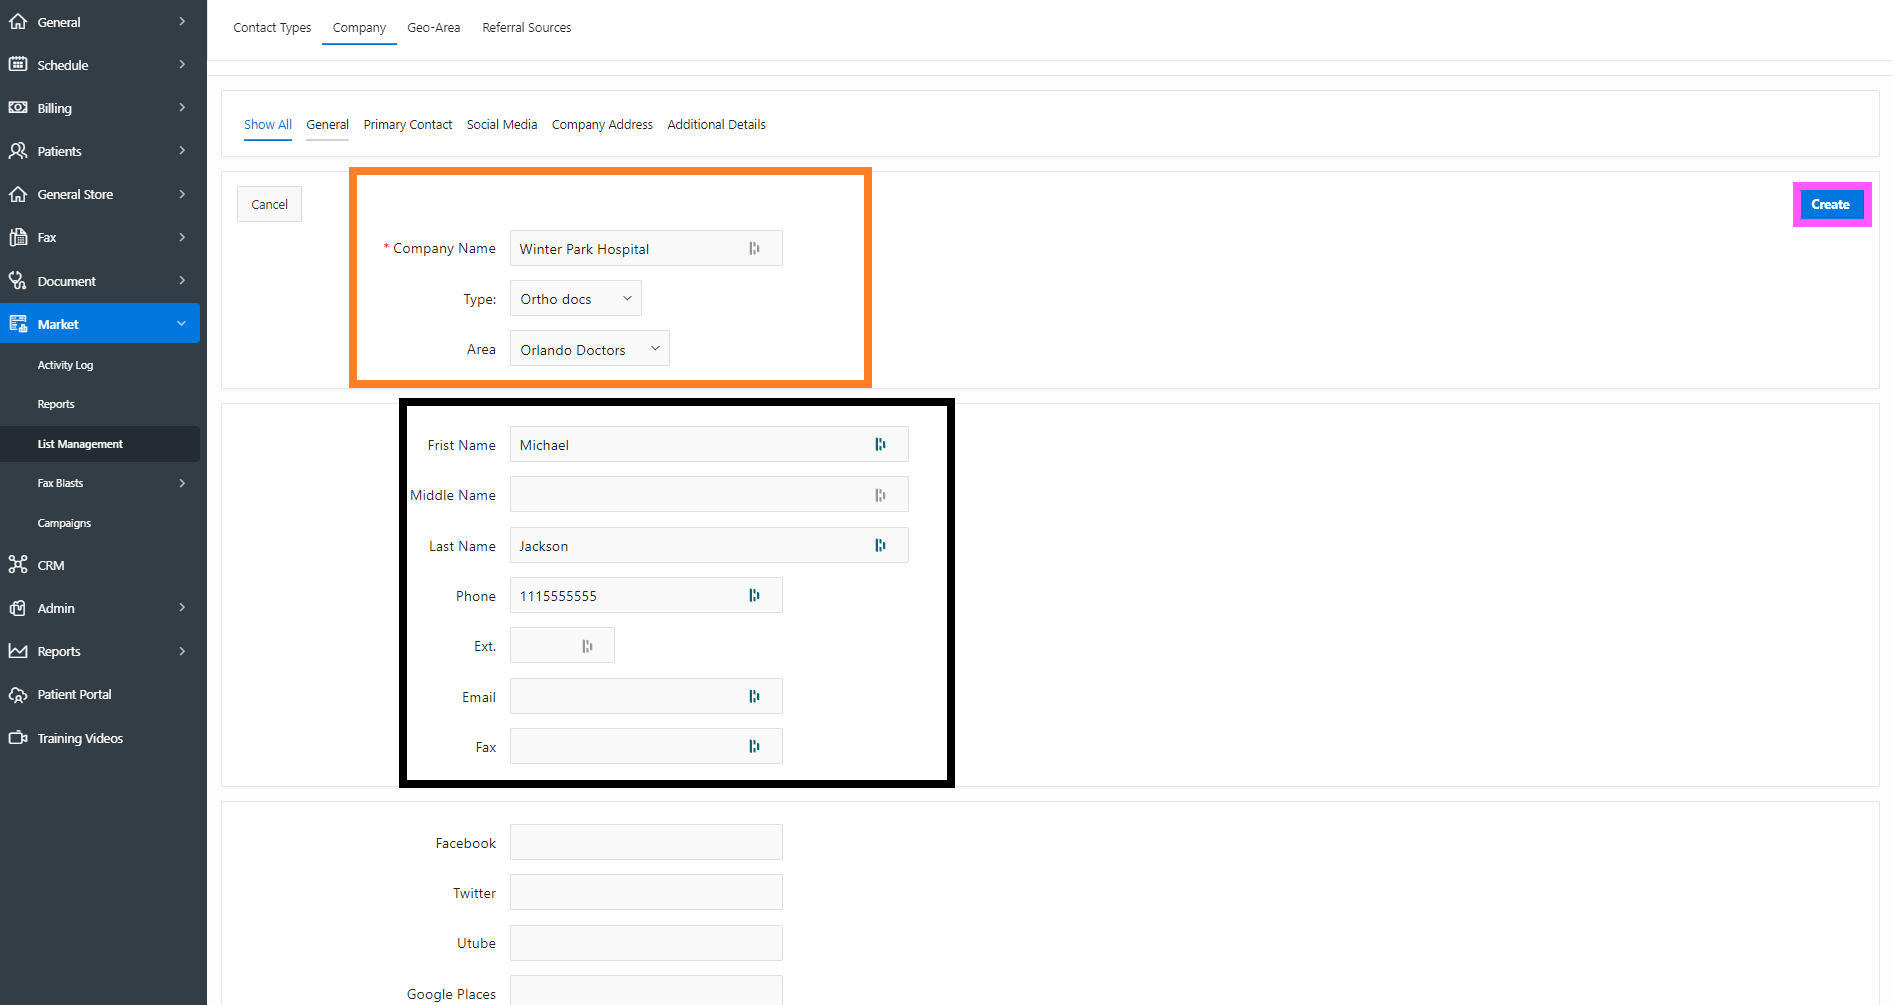
 When creating a new referring company:
- Orange Box
- Add Company, Type and Area
- Black Box
- Add First Name, Last Name, Phone number, etc...(these fields are optional)
- Pink Box
- Click Create when finished
- 4
-
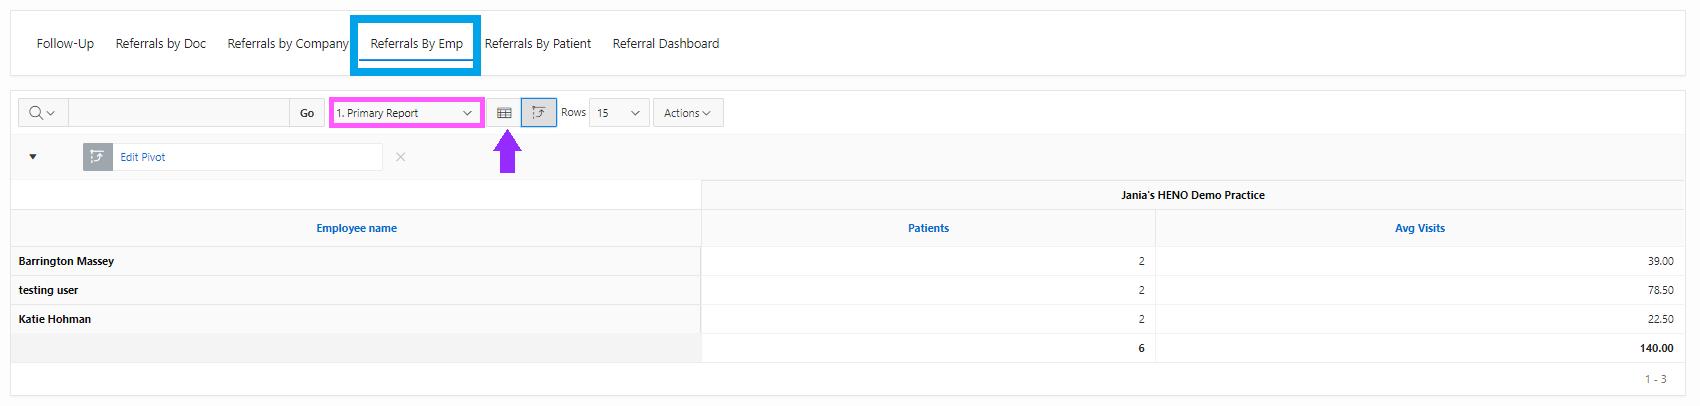
Referrals by Employee
This report generates the total number of referrals from your employees. You will automatically be in the Pivot view.
- Purple Arrow
- Click the grid icon to change the view to a chart view
- Pink Box
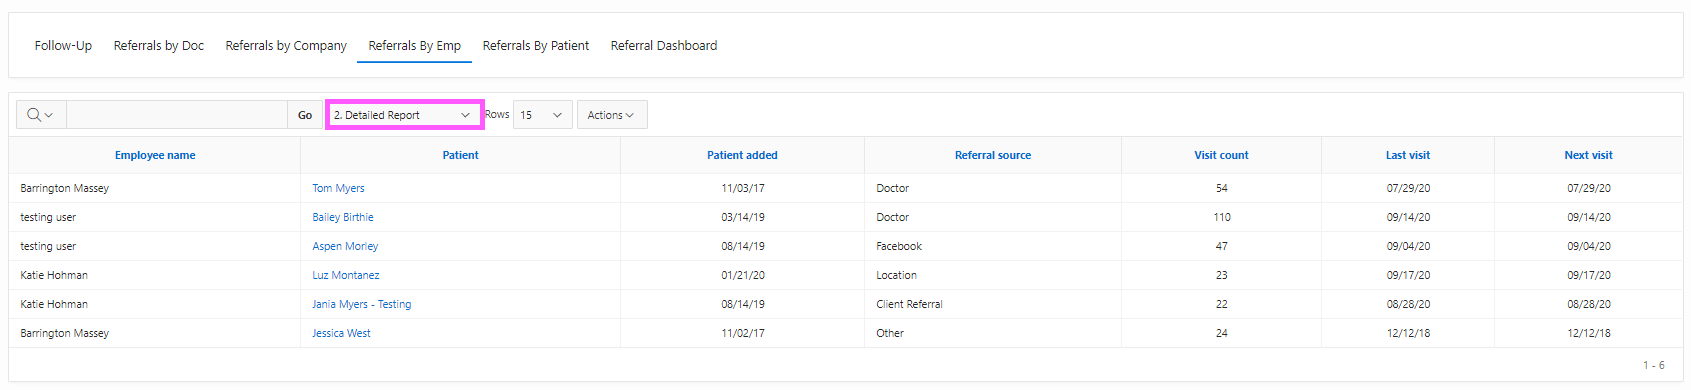
- To view more details, change the report to Detailed Reports
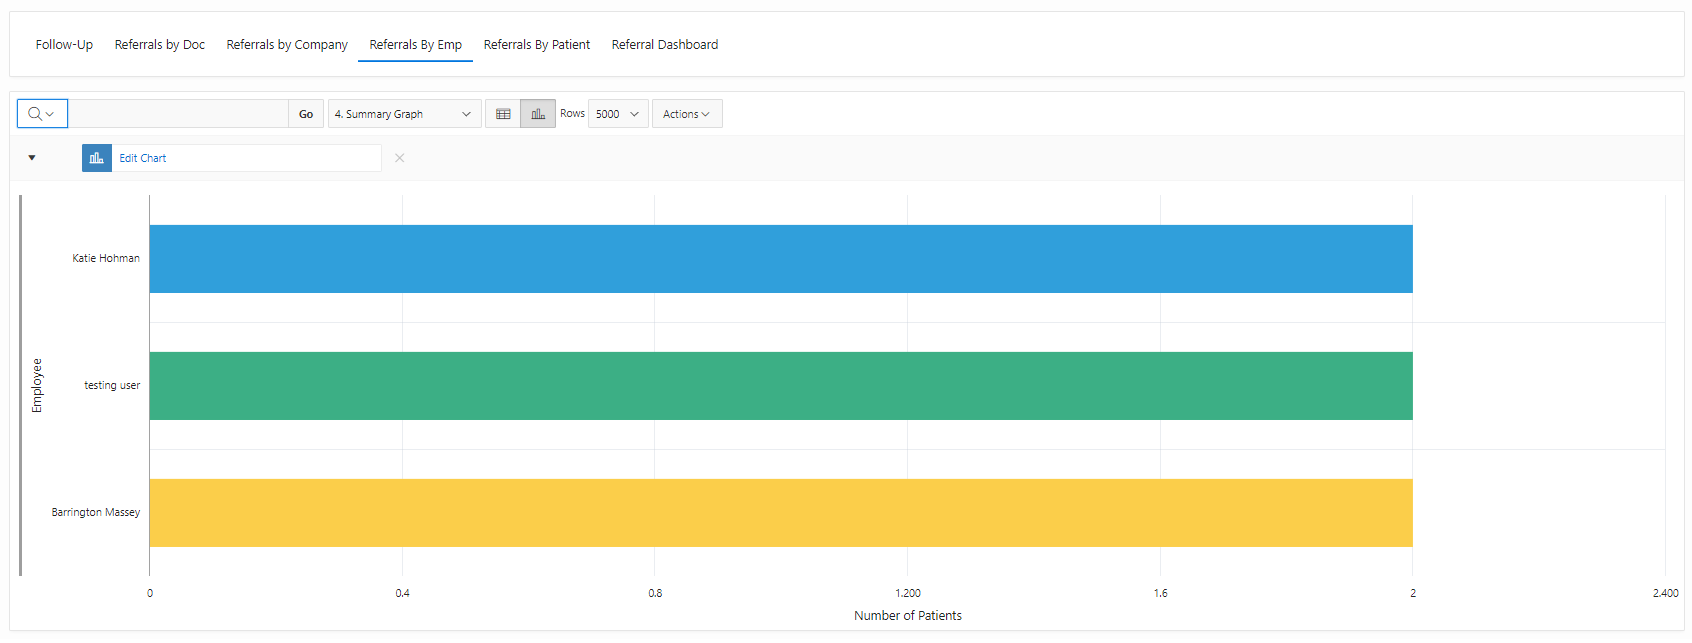
If you prefer to see a graph/chart, you can also display a graph summarizing your referrals by employees. Graphs can also be created for the referrals from doctors, companies and patients tabs.
- Orange Box
- If you are wanting to view a graph version of this report, click on the drop down and select Summary Graph
- Red Arrow
- To view the referrals back to a report view, click the chart icon
- Purple Box
- To edit what chart you want to view, click the Edit Chart filter
 Customize how you want your chart to look and how you want it to calculate the referrals by your employees.
- Purple Box
- Select which graph you would like to change to
- Pink Box
- Select from the drop downs what you want your label and value to display. You can also select how you want the graph to function and sort the referrals. Give a title for your Axis Label and Value
- Red Box
- Click Apply Changes once finished.
 Once you have applied the changes, you will be able to view your new graph and edit it as you please.
- 5
-
Referrals by Patient
To view referrals given by patients, click on the Referrals by Patient tab.
- Orange Box
- Edit this chart to view it in a different graph
- Black Box
- Click her to edit how you want the referrals to be filtered out
- Pink arrow
- Click the chart icon to view a detailed report
 Clicking the chart icon gives you a more detailed view of the referrals made by your patients
- Purple Box
- This column will list the referred patients. Click on the patient name to view their profile.
- Pink Box
- Your referring patient can be viewed. You will not be able to click on the name and view the patient.
- Orange Box
- This column will give you the visit count for each referred patient
- Red Box
- Here you will see the last visit and next visit of the referred patient at a glance

- 6
-
Referral Dashboard
This report links patient evaluations to their referring doctors. It generates the report on a weekly and monthly basis.
- Dark Red Box
- View referrals by each location or view referrals for all locations.
- Blue Box
- Toggle between viewing referring doctors by week and month. You can also toggle between viewing your sources by month and week. View you're top 10 doctors and all data.
- Purple Boxes
- When clicking on the Referral Dashboard tab, you will first see your Evals By Referring Provider - Next Week, This Week, and Last Week at first glance.

- 7
-
Top 10 Doctors
This report generates a graph view of the top ten referring doctors from the past two years.
- Green Box
- The years will be separated by color so you can easily track the two years of referrals at a glance.

- 8
-
All data
This report generates data from every referral source including patients, employee, doctors and companies.
- Pink Box
- Click on the referred patient name to view the patient profile.
